data manipulation and visualization with Python
Dates
tbd
Course overview
One of the strengths of the Python language is the availability of mature, high-quality libraries for working with scientific data. Integration between the most popular libraries has lead to the concept of a "scientific Python stack": a collection of packages which are designed to work well together. In this workshop we will see how to leverage these libraries to efficiently work with and visualize large volumes of data.
Workshop format
The workshop is delivered over ten half-day sessions. Each session consists of roughly a one hour lecture followed by two hours of practical exercises, with breaks at the organizer’s discretion. Each session uses examples and exercises that build on material from the previous one, so it’s important that students attend all sessions. The last two sessions will be kept free for students to work on their own datasets with the assistance of the instructor. A description of the sessions can be found at the bottom of this page.
Who should attend
This workshop is aimed at researchers and technical workers with a background in biology and a basic knowledge of Python (if you've taken the Introductory Python course then you have the Python knowledge; if you're not sure whether you know enough Python to benefit from this course then just drop us an email).
Requirements
Students should have enough biological/bioinformatics background to appreciate the example datasets. They should also have some basic Python experience (the Introduction to Python course will
fulfill these requirements). Students should be familiar with the use of lists, loops, functions and conditions in Python and have written at least a few small programs from
scratch. Students will require the scientific Python stack to be installed on their laptops before attending; instructions for this will be sent out prior to the course.
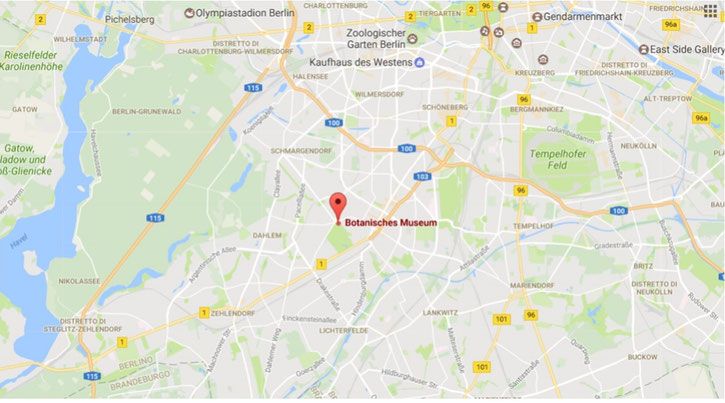
WHERE
Botanischer Garten und Botanisches Museum (BGBM) Berlin-Dahlem
Freie Universität Berlin
Königin-Luise-Straße 6-8
14195 Berlin
Program
Monday – Classes from 09:30 to 17:30
Session 1. Introduction and datasets
Jupyter (formerly iPython) is a programming environment that is rapidly becoming the de facto
standard for scientific data analysis. In this session we'll learn why Jupyter is so useful, covering
its ability to mix notes and code, to render inline plots, charts and tables, to use custom styles
and to create polished web pages.
Instructor
Dr. Martin Jones
Martin started his programming career by learning Perl during the course of his PhD in evolutionary biology, and started teaching other people to program soon after.

Cost overview
Data manipulation and visualization with Python
Course, refreshments and lunch
Data manipulation and visualization with Python
all-inclusive
580 € (VAT included)
795 € (VAT included)
For different payment options please send an email to info@physalia-courses.org
Cancellation Policy:
> 30 days before the start date = 30% cancellation fee
< 30 days before the start date= No Refund.
Physalia-courses cannot be held responsible for any travel fees, accommodation or other expenses incurred to you as a result of the cancellation.