
Data Manipulation and Visualization in Python
Dates
16th-19th October 2023
To foster international participation, this course will be held online
General Topic
Data manipulation and visualization for science-oriented applications using Python
Overview
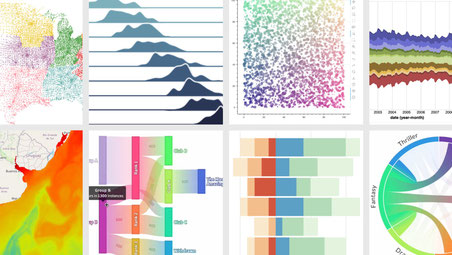
Data is everywhere, we are drowning in it, and still grasping for insights. Plots and infographics can greatly help to highlight hidden trends in the data, or to present the final results of a project, or to convey a message. Part technique, part craft, data visualization is an important tool for any field that produces and digests numbers.
In this course, we’ll learn how to organize a data visualization project, from initial data cleanup and preparation to actual visualization. We’ll cover best (and worst) practices, and we’ll see
many self-contained exercises that will familiarize the student with different plot types, from the classical line and bar charts to maps, networks and subplots.
Intended Audience
The course is structured in modules over four days. Each day will include one or more lectures with class discussions of key concepts and practices, plus practical hands-on sessions with
collaborative exercises where students will interact with the whole class and instructors to apply the acquired skills. After and during each exercise, results will be interpreted and
discussed.
In practical terms, the students will be required to write code in the form of jupiter notebooks, plus standard python scripts. To do so there two main options:
- online with a google account, use google drive and colab
- locally, installing jupiter on your own computer
Assumed Background
The course is aimed at students, researchers and professionals interested in improving their data visualization skills. While science-oriented problems are the most common application, any field
that produces data could be fertile ground for data visualization.
Some familiarity with Python is required, but attendants are not expected to be masters. If you want to improve your Python skills in preparation for the course, please have a look at these
exercise.
Learning outcomes
At the end of the course the student will have an understanding of:
- the best practices for organizing a data-visualization oriented project
- the worst practices (to avoid!) when you are presenting data
- how to manipulate the initial data using the well known libraries numpy and pandas
- how to implement the most common chart types…
- ....and some of the more obscure ones
- how to implement simple interactive charts
- a general understanding of the seaborn library
- how to adapt the many examples seen in the course to real world applications
Program
The course is from Monday to Thursday, 2-8 pm Berlin time
The pace of the course will be tuned on the students’ familiarity with python (or lack thereof). Theoretical lessons will be paired with hands-on exercises so that the student will try right away
what has been explained. In general the course will follow a “learn by doing” approach, spawned by the belief that this kind of skill can only be acquired through direct experience.
All the code we’ll encounter will remain with the students after the course and will be easily adapted to their future needs and problems.
Monday
- What is data visualization?
- Introduction to Jupyter (formerly iPython):
- How to set up a dataviz project
- Sample datasets, types of datasets (Bring Your Own Data!)
- Intro to Python, example plots
- Intro to Numpy
- Introduction to Pandas
Tuesday
- More pandas, data manipulation, aggregation
- Matplotlib: various core plots
- Matplotlib: customization, multiplot
Wednesday
- The Seaborn plotting library
- Standard plots, distribution plots, multiplots
Thursday - practice, practice, practice
- Maps and geographical plots
- Interactive plots with plotly
- Guided exercises

Cost overview
Cancellation Policy:
> 30 days before the start date = 30% cancellation fee
< 30 days before the start date= No Refund.
Physalia-courses cannot be held responsible for any travel fees, accommodation or other expenses incurred to you as a result of the cancellation.