Data visualization in R with ggplot2
Dates
ONLINE, 13-15 November 2023
To foster international participation, this course will be held online
Overview
The proficiency to visualise intricate datasets is a fundamental skill, pivotal not only in fostering a deep understanding of complex phenomena but also in effectively communicating within (and
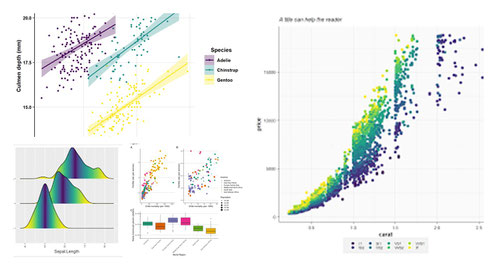
beyond) the scientific community. A meticulously crafted plot can convey more information than an extensive body of text...
The primary objective of this intensive three-day course is to elucidate the efficient utilisation of R, tidyverse, and ggplot for the construction of sophisticated and enlightening scientific
plots. Commencing with a foundational understanding of R, participants will emerge from the course equipped with the ability to proficiently load, manipulate, and visualise their own tabular
data, while possessing the finesse to refine the aesthetic appearance of their plots. Practical sessions will be thoughtfully employed to facilitate discussions surrounding the strategic choices
that optimise the informativeness and captivation of plots.
requirements
- Basic knowledge of R programming language
- Familiarity with tabular data structures
- Understanding of basic statistical concepts
Learning Outputs
- Ability to load, manipulate, and visualize tabular data using R and ggplot
- Understanding the principles of the grammar of graphics and its implementation in ggplot Proficiency in creating various types of plots such as points, lines, bars, and boxes
- Skill to customize plot aesthetics including colors, scales, and themes
- Knowledge of advanced techniques for combining multiple data tables and plots in a single figure
- Competence in exporting and saving plots for use in presentations, reports, or publications
Session content
Day 1. 2-8 pm Berlin time:
Introduction to R, ggplot, and the tidyverse
Overview of the grammar of graphics and its application in ggplot
Data carpentry: Introduction to manipulating and cleaning tabular data
Day 2. 2-8 pm Berlin time:
Creating basic plots: Points, lines, bars, and boxes
Fine-tuning plot aesthetics: Colors, scales, and themes
Enhancing plots with annotations and labels
Day 3. 2-8 pm Berlin time:
Advanced plot techniques: Combining multiple data tables in the same plot
Creating multi-panel plots and faceting
Exporting and saving plots in various formats

Inscripciones
Should you have any further questions, please send an email to info@physalia-courses.org
Cancellation Policy:
> 30 days before the start date = 30% cancellation fee
< 30 days before the start date= No Refund.
Physalia-courses cannot be held responsible for any travel fees, accommodation or other expenses incurred to you as a result of the cancellation.