
Genomic Data Visualisation with Python
Dates
22-24 June 2026
To foster international participation, this course will be held online
Course overview
Modern genomics produces complex, high-dimensional datasets that require clear and effective visualization for proper interpretation and communication. This course provides a hands-on, practical introduction to creating publication-quality genomics figures using Python. Over three afternoons, participants will develop a personal toolkit of reusable scripts covering a wide range of visualizations, from volcano and Manhattan plots to phylogenetic trees and pangenome graphs.
Target audience and assumed background
Participants are expected to be familiar with the Python programming language. A brief introduction to Python and the Python visualization ecosystem will be provided during the first half of the first day to ensure everyone starts with a common foundation.
Key Python Libraries
Throughout the course, participants will work with a combination of general-purpose and genomics-specific Python libraries.
General visualization
-
Matplotlib
-
Seaborn
-
Plotly
Genomics-specific
-
PyComplexHeatmap – complex, clustered heatmaps with annotations (Python port of R’s ComplexHeatmap)
-
pyCirclize – circos plots for genome-wide relationships
-
Toytree – phylogenetic tree drawing and manipulation
-
pyMSAviz – multiple sequence alignment visualization
-
DashBio (Plotly) – interactive genomics widgets (volcano plots, Manhattan plots, alignment viewers, circos plots)
-
pyGenomeTracks – genome browser-style track visualizations
-
dna_features_viewer – gene maps and genomic feature diagrams
-
JCVI / MCscan – synteny and comparative genomics plots
-
UpSetPlot – visualization of complex set intersections
-
PyWaffle – waffle charts
-
gget – gene and pathway enrichment queries and visualization
-
Biopython (Bio.Phylo, Bio.Graphics) – sequence and phylogenetic utilities
Session content
Monday — 1:00 to 6:00 PM (Berlin time)
-
Introduction to Python and the Python visualization ecosystem
-
Volcano plots
-
Dimensionality reduction plots (PCA, t-SNE, UMAP)
-
Peak visualization
-
Pathway and annotation plots
-
Heatmaps, waffle plots, and waterfall plots
Tuesday — 1:00 to 6:00 PM (Berlin time)
-
Stacked bar plots
-
Time series plots
-
Multiple sequence alignment visualization
-
Manhattan plots
-
Genome statistics plots (e.g. genome coverage, gene graphs)
Wednesday — 1:00 to 6:00 PM (Berlin time)
-
Phylogenetic trees
-
Circos plots
-
Venn diagrams and UpSet plots
-
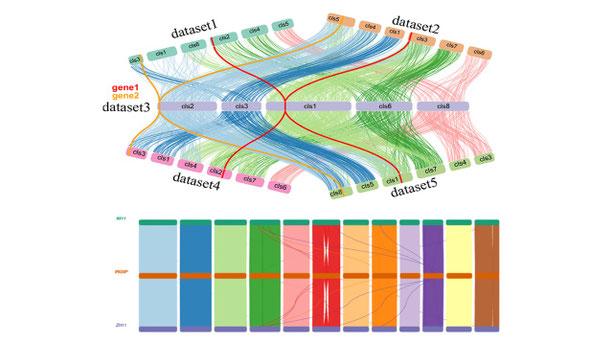
Synteny plots
-
Ideograms
- Creating an AI agent for making scientific graphs

COst overview
related courses
1 - Introduction to Python for biologists, ONLINE, 9-12 February
2- Advanced Python for Data Science and Bioinformatics - ONLINE, 23-26 March
3 - Cancer Genomics - ONLINE, 27-29 April
4 - RNAseq for beginners - ONLINE, 19th-28th of May
Cancellation Policy:
> 30 days before the start date = 30% cancellation fee
< 30 days before the start date= No Refund.
Physalia-courses cannot be held responsible for any travel fees, accommodation or other expenses incurred to you as a result of the cancellation.