
RNAseq data analysis for Beginners
Dates
20th-21st-22nd-26th-27th-28th of May 2026
To foster international participation, this course will be held online
Course overview
This six‑day, hands‑on course takes participants from raw FASTQ files to publication‑ready figures and pathway analyses. Designed specifically for wet‑lab biologists with no programming background, the course uses repeatable, well‑documented pipelines and a cloud environment so you can follow along and apply the workflow directly to your own data.
Key points
Practical by design: Participants will practice learned concepts with hands-on sessions.
Cloud ready: Pre‑configured analysis environment so participants can start analysing immediately.
Reproducible outputs: Every participant leaves with reproducible analysis scripts and publication‑quality figures.
Mentored learning: Small class size, live troubleshooting, and active Q&A to solve your dataset problems.
Target Audience
Suitable for PhD students, postdocs, clinicians, research scientists, lab managers and PIs who want to gain hands‑on skills to analyse bulk RNA‑seq data themselves. No prior command‑line
experience required; basic R knowledge is preferred.
Learning outcomes
By the end of the course participants will be able to:
- Manage a reproducible RNA‑seq analysis environment (conda,, R/Bioconductor).
- Convert raw FASTQ files into a gene count matrix (alignment/pseudo‑alignment and feature counting).
- Perform QC at both the sequencing and count levels and make informed preprocessing decisions.
- Run statistically sound differential expression analyses (limma/voom, DESeq2, edgeR) and interpret results.
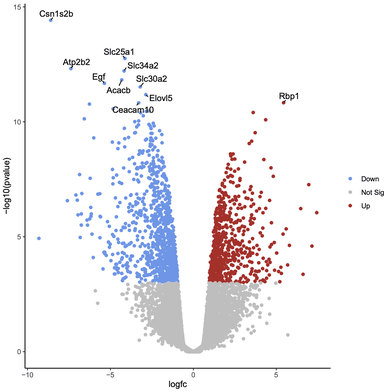
- Produce publication‑quality visualizations (volcano plots, MA plots, heatmaps, PCA) and multi‑panel figures.
- Perform functional enrichment (GO, KEGG, GSEA) and turn gene lists into biological stories.
- Handle real‑world challenges such as how to detect batch effects, how to include covariates in models, and how to apply (or not) batch effect correction (ComBat).
Session content
Day 1 - May 20th - 3-6 PM Berlin time— Building your computational foundation
Theme: Decoding NGS formats & QC
Goals & hands‑on: Next-generation sequencing, RNA sequencing, FASTQ format and Phred scores, FastQC reports, read and interpret GTF/GFF, inspect BAM/SAM basics, discuss
when/if to trim. Run FastQC on real datasets and interpret results.
Day 2 - May 21st- 3-6 PM Berlin time— From raw reads to count matrix
Theme: Alignment and quantification
Goals & hands‑on: Build STAR genome index, run STAR alignments, interpret mapping statistics, run featureCounts and Salmon (pseudoalignment) and produce a merged count
matrix. Discuss gene‑ vs transcript‑level quantification.
Day 3- May 22nd - 3-6 PM Berlin time—Introduction to R for RNA‑seq analysis
Theme: Import data into R
Goals & hands‑on: R syntax and data structures (recap), importing count matrices, initial exploratory plots, normalization concepts and hands‑on normalization comparisons
(TPM, TMM, voom). Participants write reproducible R scripts.
Day 4 -May 26th - 3-6 PM Berlin time—Statistical analysis: Finding DEGs
Theme: From counts to differentially expressed genes
Goals & hands‑on: Experimental design and contrasts, QC at sample level (PCA, correlation, heatmaps), run limma‑voom pipeline step‑by‑step, interpret results tables, produce
DEG lists and sanity checks. Compare outputs with DESeq2/edgeR where informative.
Day 5- May 27th - 3-6 PM Berlin time— Visualization & biological interpretation
Theme: Publication‑ready figures & pathways
Goals & hands‑on: ggplot2 basics and building publication plots (volcano, MA, PCA, heatmap), combine plots into multi‑panel figures, perform ORA and GSEA, visualize
enrichment results and draft a short biological interpretation.
Day 6 - May 28th- 3-6 PM Berlin time - Advanced topics
Theme: Handling complex analyses & Q&A
Goals & hands‑on: Detect and visualise batch effects, include covariates in models, apply (and when not to apply) batch correction (ComBat), basics, Salmon vs STAR
recap. Course wrap‑up and open Q&A for participant projects.

COst overview

related courses
1 - Dealing with messy data in R - ONLINE, 8-10 April
2 - Gene Set Enrichment Analysis in R - ONLINE, 11-15 May
Cancellation Policy:
> 30 days before the start date = 30% cancellation fee
< 30 days before the start date= No Refund.
Physalia-courses cannot be held responsible for any travel fees, accommodation or other expenses incurred to you as a result of the cancellation.