
Genomic Data Visualization and Interpretation
Dates
8-12 April 2019
Course webpage: genviz.org
Where
Institut für Biologie, Freie Universität Berlin, Königin-Luise-Straße 1-3, 14195 Berlin
Topic
Advanced R and bioinformatics applications for visualization and interpretation of genomic data.
overview
The advent of rapid and relatively cheap massively parallel sequencing has dramatically increased the availability of genome, transcriptome, and epigenome profiling. Analysis workflows and published best practices are also now available to process raw sequence data into alignments, variant calls, expression estimates, etc., in relatively standardized file formats. Interpretation and visualization of these data, often consisting of thousands to billions of data points, and extracting biological meaning remains a serious challenge. In this workshop we will explore a number of best-in-class visualization tools, and provide working examples that demonstrate important principles of ‘omic interpretation strategies.
Workshop format
The workshop will be delivered over the course of five days. Each day will include an introductory lecture with class discussion of key concepts. The remainder of each day will consist of practical hands-on sessions. These sessions will involve a combination of both mirroring exercises with the instructor to demonstrate a skill as well as applying these skills on your own to complete individual exercises. After and during each exercise, interpretation of results will be discussed as a group. Computing will be done using a combination of tools installed on the attendees laptop computer and web resources accessed via web browser.
Who should attend
This workshop is aimed at researchers and technical workers who are analyzing some kind of omic data (e.g. WGS, exome, RNA-seq, variant files, etc.). Examples demonstrated in this course will involve primarily human genome/transcriptome data but many of the concepts learned will be applicable to model organisms, metagenomics, simulated data, etc.
Requirements
Attendees should have a background in biology and a basic knowledge of R. We will dedicate one session to a brief R/linux primer. Attendees should have also some familiarity with genomic data. The course will teach relatively advanced usage of R (especially ggplot2 and Bioconductor packages). Attendees should have a working installation of R and RStudio on their laptop.
Example data
Attendees will learn to visualize and interpret results from real human genome data sets generated at the McDonnell Genome Institute at Washington University School of Medicine. These data will be analyzed to determine previously known as well as potentially novel interpretations. Since the example data are not simulated or arbitrarily filtered, interpretation and visualization will be performed in the context of representative levels of sequence error, and other sources of technical and biological noise.
Program
Classes from 9:30 to 17:30
Lecture 1: Introduction to Genomic Data Visualization and Interpretation
-
Central dogma
-
Omic technologies and data
-
Reference files: GTF, BAM, VCF, MAF, BED, etc
-
Genome annotation resources, browsers, etc.
-
Introduction to demonstration data sets
Cost overview
Package 1:
Course material and refreshments
Package 2:
Course material, refreshments, accommodation and lunch
Please click HERE to get all the information about our packages.
Registration deadline: 15th March 2019
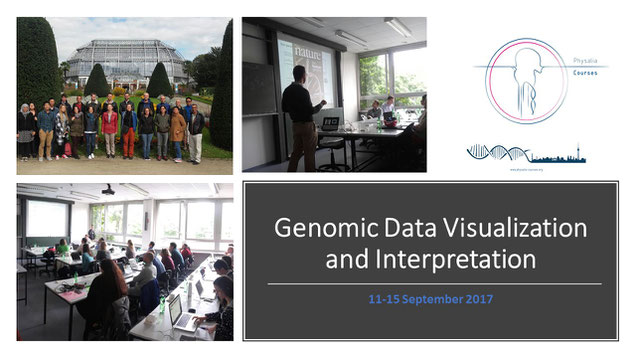
First edition:
Berlin, 11-15 September 2017
http://genviz.org/
19 attendees
16 research institutes
7 different countries
Cancellation Policy:
> 30 days before the start date = 30% cancellation fee
< 30 days before the start date= No Refund.
Physalia-courses cannot be held responsible for any travel fees, accommodation or other expenses incurred to you as a result of the cancellation.